
A/B Testing for Conversion Rate Optimization: How Does It Work?
A website can receive thousands of visitors every month and still generate disappointing sales, leads, sign-ups, or inquiries. The problem is not always traffic. Sometimes visitors simply are not taking the actions a business wants them to take. This is where A/B testing for conversion rate optimization becomes a valuable strategy.
A/B testing, also called split testing, compares two versions of a webpage, landing page, email, advertisement, or another digital experience to determine which version performs better. Typically, visitors are randomly divided between a control version and a variation, and their behavior is measured against a specific conversion goal.
Instead of changing a website based only on personal opinions, businesses can use real visitor data to understand what actually improves performance. A stronger headline, clearer call-to-action, shorter form, better product description, or improved page layout could potentially increase conversions—but testing helps determine whether the change really works.
For small businesses, this approach can be particularly useful because improving the conversion rate can produce more value from existing traffic without requiring a major increase in advertising spending.
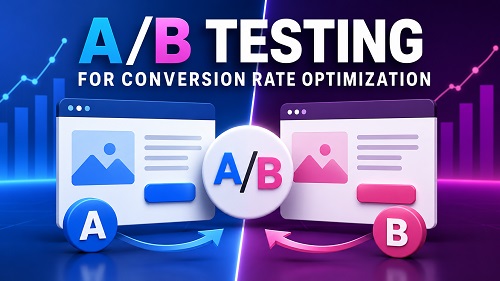
![A/B testing concept showing two website versions, labeled A and B, being compared for conversion rate optimization with analytics and growth visuals. ([optimizely.com][1]) [1]: https://www.optimizely.com/optimization-glossary/ab-testing?utm_source=chatgpt.com "A/B testing"](https://smartwebcreator.org/wp-content/uploads/2026/09/ChatGPT-Image-Sep-2-2026-07_30_33-PM-1024x576.png)
What Is A/B Testing for Conversion Rate Optimization?
A/B testing for conversion rate optimization is a data-driven method used to compare two different versions of a webpage, landing page, CTA, form, email, or other digital element. The main purpose is to determine which version performs better and encourages more users to complete a desired action.
In a typical A/B test, the original version is called Version A (Control), while the modified version is called Version B (Variation). Website visitors are randomly divided between these two versions. One group sees Version A, while another group sees Version B. Their actions are then tracked and compared using a specific conversion goal.
For example, suppose an online store has a landing page with a “Learn More” button. The business could create a second version using “Get Started Today.” Some visitors would see the original CTA, while others would see the new CTA. After collecting enough data, the business can compare which version generates more clicks, leads, or sales.
The goal of A/B testing for conversion rate optimization is not simply to determine which page looks more attractive. Instead, it focuses on measurable results and asks important questions about user behavior, such as:
- Which headline generates more email sign-ups?
- Which CTA encourages more visitors to take action?
- Which landing page produces more qualified leads?
- Which product-page design generates more purchases?
- Which form receives more completed submissions?
- Which offer creates a higher conversion rate?
How Does A/B Testing for Conversion Rate Optimization Work?
A/B testing for conversion rate optimization follows a structured process. Although testing platforms can differ, the fundamental workflow is generally similar.
1. Identify a Conversion Problem: A/B Testing for Conversion Rate Optimization
Start by finding a page or customer journey step that is underperforming.
For example, your analytics might show that a landing page receives substantial traffic but very few visitors complete the lead form. That could indicate an opportunity for conversion optimization.
Useful data sources can include:
- Website analytics
- Conversion reports
- Heatmaps
- Session recordings
- User feedback
- Customer surveys
- Form abandonment data
- Checkout abandonment data
The goal is to identify a specific problem rather than randomly changing website elements.
2. Define a Clear Goal: A/B Testing for Conversion Rate Optimization
Every experiment should have a measurable objective.
Possible goals include:
- Increasing purchases
- Increasing email sign-ups
- Increasing contact-form submissions
- Increasing CTA clicks
- Increasing demo requests
- Increasing downloads
- Increasing registrations
- Reducing checkout abandonment
For example:
“We want to increase completed lead-form submissions on our service landing page.”
That is much more useful than saying:
“We want to make the page better.”
3. Create a Test Hypothesis: A/B Testing for Conversion Rate Optimization
A hypothesis explains what you expect to happen and why.
For example:
“Changing the CTA from ‘Submit’ to ‘Get My Free Consultation’ will increase form submissions because the new wording communicates the value of the next step more clearly.”
A strong hypothesis connects a specific change with a specific expected outcome.
4. Create Version B:
Keep Version A as your control and create a variation that contains the planned change.
Depending on your experiment, Version B might contain:
- A different headline
- A new CTA
- A shorter form
- Different images
- Alternative pricing presentation
- Different product descriptions
- A redesigned hero section
- Customer testimonials
- Different button placement
5. Split the Traffic: A/B Testing for Conversion Rate Optimization
Visitors are randomly assigned to the control or variation. The testing system records which version each visitor experiences and measures their subsequent behavior. This random comparison is what allows businesses to evaluate the impact of the change rather than simply comparing two unrelated groups.
6. Collect Data: A/B Testing for Conversion Rate Optimization
Once the experiment is running, collect enough relevant data to make a responsible decision.
Do not assume that an early lead automatically means you have a winner. Conversion rates can fluctuate naturally, particularly when the number of visitors and conversions is small.
7. Analyze the Results: A/B Testing for Conversion Rate Optimization
Compare the performance of Version A and Version B using your primary conversion metric.
You might examine:
- Conversion rate
- Number of conversions
- Relative improvement
- Revenue
- Average order value
- Lead quality
- Engagement metrics
- Statistical significance
Statistical significance helps determine whether the observed difference is sufficiently unusual under the assumption that there is actually no difference between the versions. Sample size and effect size both influence how reliable the conclusion can be.
8. Implement the Learning: A/B Testing for Conversion Rate Optimization
If the variation produces a reliable improvement, implement the winning experience where appropriate.
If neither version clearly wins, that is still useful information. You can use the result to develop another hypothesis and run a better-informed experiment.
A/B testing is therefore not about making every experiment successful. It is about continuously learning what helps your audience convert.
Why A/B Testing for Conversion Rate Optimization Matters for Businesses?
A/B testing for conversion rate optimization can help businesses make better website decisions based on evidence rather than assumptions.
Suppose a website receives 20,000 monthly visitors. Increasing traffic is one way to generate more conversions, but improving the percentage of existing visitors who convert can also increase business results.
For example, if 20,000 visitors produce a 2% conversion rate, that equals 400 conversions. If a successful optimization increases the conversion rate to 2.5%, the same traffic would produce 500 conversions.
The example is illustrative rather than a guaranteed outcome, but it demonstrates why conversion rate optimization can be valuable.
Other benefits include:
Better Understanding of Customers
Testing can reveal what messaging, offers, layouts, and experiences resonate with visitors.
Reduced Guesswork
Instead of asking whether a particular design “looks better,” you can evaluate whether it produces better results.
More Efficient Marketing Spend
If you are already paying for traffic, increasing the percentage of visitors who convert can improve the value of that traffic.
Continuous Improvement
A/B testing can become an ongoing process. One experiment can produce an insight that inspires the next experiment.
What Elements Should You Test With A/B Testing?
There are many potential A/B testing examples for websites, but not every element deserves equal attention.
Headlines:
Your headline is often one of the first things visitors see. Test whether a clearer benefit-focused headline generates more engagement.
For example:
Version A:
“Digital Marketing Services”
Version B:
“Get More Qualified Leads With Digital Marketing”
The second version emphasizes an outcome rather than simply naming a service.
Call-to-Action Buttons:
CTA testing is one of the most common forms of conversion optimization.
You could test:
- Get Started
- Start Your Free Trial
- Book a Consultation
- Get My Free Quote
- Download the Guide
- Shop Now
However, don’t assume a particular phrase will always win. Your audience and offer determine the result.
Landing Page Design:
You can test:
- Page structure
- Hero section
- Image placement
- Testimonials
- Benefits
- CTA placement
- Pricing presentation
- Trust signals
Forms:
Forms can create friction when they request too much information.
You could test a long form against a shorter version.
For example:
Version A: Name, email, phone, company, job title, budget, message
Version B: Name, email, message
The shorter form might increase submissions, but you should also consider lead quality—not simply the number of submissions.
Product Pages:
For ecommerce websites, test:
- Product images
- Product descriptions
- Reviews
- Shipping information
- Buy buttons
- Product benefits
- Trust badges
- FAQ sections
A/B Testing for Conversion Rate Optimization: Choosing the Right Metrics
A/B testing for conversion rate optimization becomes much more effective when the right metrics are selected before the experiment begins.
Your primary metric should directly relate to the hypothesis.
For example, if you change a CTA button, CTA clicks may be an appropriate primary metric. If you change a checkout experience, completed purchases may be more appropriate.
You can also monitor secondary metrics to identify unintended effects.
Important metrics include:
Conversion Rate
Conversion rate measures the percentage of visitors who complete the desired action.
A basic formula is:
Conversion Rate = Conversions ÷ Visitors × 100
For example, if 1,000 visitors produce 40 conversions:
40 ÷ 1,000 × 100 = 4%
Conversion Lift:
Conversion lift shows how much the variation improved or declined relative to the control.
Revenue Per Visitor:
For ecommerce businesses, a variation that produces slightly fewer orders but substantially higher-value orders could potentially be more valuable.
Average Order Value:
A/B testing can reveal whether a page change influences how much customers spend.
Lead Quality:
For lead-generation businesses, more leads are not necessarily better if those leads are poorly qualified.
This is why businesses should connect CRO experiments with meaningful business outcomes rather than focusing exclusively on clicks.

How to Run an A/B Test Step by Step?
A practical A/B testing strategy can follow these steps:
- Step 1: Analyze your website data. Find pages with significant traffic and conversion problems.
- Step 2: Choose one problem. Avoid trying to fix everything in one experiment.
- Step 3: Create a hypothesis. Explain what you will change and why.
- Step 4: Select a primary metric. Decide what success means before launching.
- Step 5: Create Version B. Make a focused change based on your hypothesis.
- Step 6: Verify tracking. Make sure visits, clicks, conversions, and other important events are recorded correctly.
- Step 7: Launch the experiment. Randomly expose eligible visitors to the control and variation.
- Step 8: Allow enough data to accumulate. Do not make decisions based on a tiny sample.
- Step 9: Analyze statistical evidence. Consider statistical significance, confidence intervals, sample size, and practical business impact.
- Step 10: Document the result. Record the hypothesis, test conditions, results, and lessons learned.
- Step 11: Implement or iterate. Apply a clear winner where appropriate or use the findings to develop your next test.
A/B Testing Examples for Small Businesses:
Small businesses do not necessarily need complicated experiments. They can begin with simple, high-impact tests.
Local Service Business:
A cleaning company could test:
A: “Professional Home Cleaning Services”
B: “Book a Reliable Home Cleaning Service Today”
The business could measure completed booking requests.
Online Course Business:
An online course creator could test two CTA variations:
A: “Enroll Now”
B: “Start Learning Today”
The primary metric could be completed enrollments.
Ecommerce Business:
An online store could test different product-page layouts.
Version A might place customer reviews below the product description.
Version B might display ratings and reviews closer to the purchase button.
The primary metric could be completed purchases or revenue per visitor.
Small Digital Marketing Agency:
An agency could test different landing-page headlines to determine which generates more consultation requests.
These examples show that conversion optimization for small businesses does not have to begin with expensive or complicated changes.
Common A/B Testing Mistakes to Avoid:
Even a well-designed experiment can produce misleading conclusions if it is poorly planned.
Testing Too Many Changes at Once:
If you change the headline, CTA, images, pricing, layout, and form simultaneously, you may not know which change caused the result.
For beginners, focused tests are usually easier to interpret.
Ending a Test Too Early:
An early result can change as more visitors enter the experiment. Small sample sizes can create unstable conclusions.
Ignoring Statistical Significance:
A variation that has a higher conversion rate is not automatically a proven winner. Statistical analysis helps distinguish meaningful differences from random fluctuations.
Tracking Too Many Goals:
A test can become difficult to interpret when businesses monitor a large collection of unrelated objectives. Your primary metric should directly connect to the hypothesis.
Testing Tiny Changes With Very Low Traffic:
Small differences generally require more data to identify reliably. If a website receives very little traffic, testing a tiny font-size change may take a long time to produce useful evidence.
Ignoring Business Quality:
More clicks do not necessarily mean more customers.
A CTA variation might produce more clicks but fewer qualified leads. Always consider what happens further down the funnel.
A/B Testing Best Practices for Better Results:
Following proven A/B testing best practices can improve the quality of your experiments.
Start With Research:
Use analytics, customer feedback, heatmaps, and user behavior to identify potential problems before creating a variation.
Test Important Pages:
Prioritize pages that have both meaningful traffic and a meaningful business objective.
Create One Strong Hypothesis:
A focused hypothesis gives your experiment direction.
Predefine Success:
Know what metric will determine success before looking at the results.
Test Meaningful Changes:
If your traffic is limited, prioritize changes that have a reasonable chance of creating a measurable difference.
Don’t Chase Every Segment:
Segmentation can be valuable, but repeatedly searching through many audience segments increases the possibility of finding apparent patterns that are simply noise. Testing platforms themselves warn that repeatedly searching for significant segments can increase false-positive risk.
Document Every Experiment:
Keep a record of:
- Test name
- Date
- Hypothesis
- Control
- Variation
- Primary metric
- Traffic
- Results
- Statistical evidence
- Business impact
- Final decision
This creates an internal knowledge base that becomes increasingly valuable over time.
A/B Testing vs. Multivariate Testing:
A/B testing generally compares two versions of an experience. Multivariate testing, by contrast, evaluates multiple combinations of changes to understand how different elements interact.
For example, an A/B test could compare:
- Headline A vs. Headline B
A more complex multivariate experiment could simultaneously evaluate:
- Headline A vs. B
- Image A vs. B
- CTA A vs. B
This can create several combinations.
Multivariate testing can provide deeper insights, but it typically requires more traffic and more sophisticated analysis. For many small businesses and beginners, starting with focused A/B experiments is more practical.
Statistical Significance in A/B Testing for Conversion Rate Optimization:
Understanding statistics is essential for A/B testing for conversion rate optimization.
Suppose Version A converts at 3% while Version B converts at 3.5%. At first glance, B appears better.
But the difference alone does not prove that Version B caused the improvement.
Statistical significance helps evaluate how unusual the observed difference would be if there were actually no underlying performance difference. Sample size and effect size are important factors in determining how much confidence you can place in the result.
Confidence intervals are also useful because they communicate uncertainty around the estimated improvement. As more relevant data accumulates, the interval can become narrower, providing greater precision.
Businesses should also distinguish between statistical significance and business significance.
A statistically reliable 0.1% improvement might be less valuable than a larger improvement that has a meaningful impact on revenue, depending on implementation costs and business circumstances.

How Small Businesses Can Start A/B Testing on a Limited Budget?
A common misconception is that A/B testing is only for large companies with huge marketing budgets.
Small businesses can begin with a simple process.
First, choose a high-value page such as your homepage, service page, landing page, product page, or signup page.
Second, review the available analytics and identify one obvious conversion problem.
Third, create a clear hypothesis.
Fourth, make one meaningful variation.
Fifth, ensure your analytics and conversion tracking are working correctly.
Finally, run the experiment long enough to collect useful evidence and evaluate both statistical and practical results.
The most important investment is not necessarily expensive software. It is developing a disciplined experimentation process.
How A/B Testing Improves the Customer Journey?
A successful conversion rate optimization strategy should consider the entire customer journey rather than focusing only on one button.
Visitors may interact with your business through:
- Search results
- Social media
- An advertisement
- A blog article
- A landing page
- A product or service page
- A contact form
- Checkout
- Follow-up emails
A/B testing can be applied at different points in this journey.
For example, a business might discover that its landing page generates many clicks but its form generates few completed submissions. Instead of sending more traffic to the page, the company could test a simpler form.
This demonstrates an important CRO principle: more traffic is not always the answer. Sometimes the better opportunity is improving what happens after visitors arrive.
A/B Testing Tools and Analytics: A/B Testing for Conversion Rate Optimization
Modern businesses can use experimentation platforms and analytics systems to manage experiments, monitor conversion metrics, and evaluate results.
When choosing an A/B testing tool, consider:
- Website platform compatibility
- Traffic volume
- Experiment types
- Statistical analysis
- Reporting
- Integrations
- Ease of implementation
- Cost
- Technical support
However, the tool should support your strategy—not replace it.
A sophisticated testing platform cannot compensate for weak hypotheses, poor tracking, insufficient traffic, or unclear conversion goals.
Call to Action: A/B Testing for Conversion Rate Optimization
If your website is already receiving visitors but your conversions are lower than expected, A/B testing for conversion rate optimization can give you a structured way to find improvement opportunities.
Start small. Choose one important page, identify one conversion problem, create one evidence-based hypothesis, and test one meaningful change.
Don’t redesign your entire website based on assumptions. Let your visitors provide the evidence.
Ready to improve your website conversions? Start with your highest-value landing page, define one measurable goal, and create your first A/B test today.
Closing Thoughts:
A/B testing for conversion rate optimization provides businesses with a practical framework for improving digital experiences through experimentation. Instead of assuming that a particular headline, CTA, layout, or offer will perform better, businesses can create a controlled comparison and use visitor behavior to guide their decisions.
The most effective A/B testing strategy is not about running as many experiments as possible. It is about asking better questions, creating meaningful hypotheses, selecting appropriate metrics, collecting sufficient evidence, and connecting test results to real business outcomes. Statistical significance is important, but so are practical impact, lead quality, revenue, customer experience, and long-term value.
For small businesses, this makes CRO especially attractive. You do not always need more visitors to grow. Sometimes you need to help more of the visitors you already have take the right action. By continuously testing, learning, and improving, your website can become more effective at turning attention into leads, customers, and revenue.

Frequently Asked Questions:
What is A/B testing in conversion rate optimization?
A/B testing is a controlled experiment that compares two versions of a webpage or digital experience to determine which performs better against a defined goal. Visitors are generally assigned to different versions and their behavior is measured.
How does A/B testing improve conversion rates?
A/B testing helps businesses identify changes that can improve user actions such as purchases, registrations, form submissions, downloads, or CTA clicks. Instead of relying entirely on assumptions, businesses can evaluate changes using actual visitor behavior.
What should I A/B test first?
Start with a high-traffic page that has a clear conversion goal. Good starting points can include headlines, CTAs, landing-page layouts, forms, product pages, pricing presentation, and trust elements.
How long should an A/B test run?
There is no universal number of days that works for every experiment. Required sample size depends on factors including baseline conversion rate, expected improvement, traffic, and the statistical approach being used. Smaller effects generally require more data to identify reliably.
What is statistical significance in A/B testing?
Statistical significance helps evaluate whether an observed difference between the control and variation is unlikely to be explained simply by random chance. It should be considered alongside sample size, effect size, confidence intervals, and business impact.
Can small businesses use A/B testing?
Yes. Small businesses can use A/B testing to improve landing pages, service pages, product pages, forms, CTAs, emails, and other customer-facing experiences. The key is to prioritize tests that have a meaningful connection to business goals.
What happens if neither A/B test version wins?
A neutral result is still useful. It may indicate that the tested change had little effect, that the experiment needs more data, or that the hypothesis was incorrect. Use the information to develop a stronger next experiment rather than forcing a winner.

Naeem Iqbal is the founder and lead writer at SmartWebCreator.org, a resource dedicated to helping aspiring entrepreneurs launch profitable small businesses on a budget of $1,000 or less. With a focus on practical, research-backed guidance, Naeem Iqbal researches real-world startup costs, regulatory requirements, and growth strategies across dozens of low-investment business models — from food service to home-based ventures.
Every guide on SmartWebCreator.org is written to help beginners avoid costly mistakes, understand legal requirements, and build a realistic path from idea to income — without needing a large upfront investment.
📧 Contact: webcreator2474@gmail.com
🌐 Website: smartwebcreator.org



Pingback: Conversion Rate Optimization
Pingback: Conversion Rate Optimization Agency